Dose-Response Visualiser
Agonist
Below is a short animation illustrating the action of agonists on receptors:
A general schema of how agonists interact with receptors to produce a change in cellular activity is shown below.
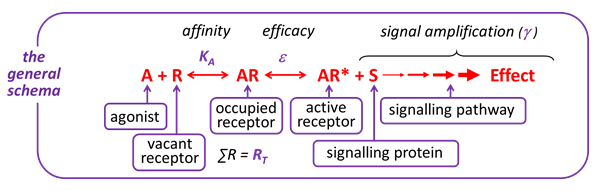
Observe the effects of changing the characteristics of the Agonist (affinity, intrinsic efficacy) and/or the Cell (receptor density, signal amplification) by moving the red slider along the grey bar to the right or left to increase or decrease the value of the characteristic, respectively.
Some clinically-used drugs act as agonists – e.g. salbutamol at the β2-adrenoceptor, adrenaline at various adrenoceptors, morphine at opioid receptors, etc.
Competitive Antagonist
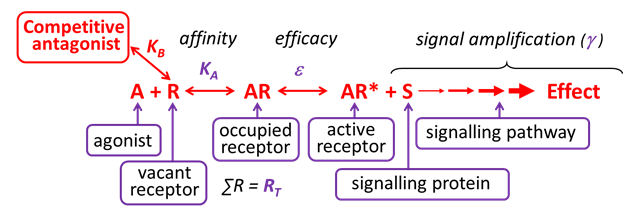
Competitive antagonists bind reversibly to the same binding site on the receptor as the agonist (orthosteric binding).
Thus, which molecule occupies the common binding site depends solely on the relative affinity and concentrations of the agonist and competitive antagonist.
Thus, theoretically the [agonist] can be raised to the point that the concomitant receptor binding by the antagonist is minimal – at this point the maximum effect of the agonist will be observed, that is competitive antagonism is surmountable.
The affinity of a competitive antagonist for a receptor can be determined from binding assays (saturation (KA) and/or competition binding (Ki) assays using radioligands) and from functional assays (KB, by measuring the rightward shift of agonist dose-response curves in the presence of increasing [competitive antagonist] – Schild analysis). Although the constants KA, Ki and KB are determined using different experimental approaches, they each represent the affinity of the competitive antagonist for a receptor, and thus should have the same molar value (the concentration required to occupy 50% of receptors).
The vast majority of clinically-used receptor antagonists are considered to act competitively – e.g. metoprolol at the β-adrenoceptor, atropine at the muscarinic cholinoceptor, losartan at the angiotensin AT1 receptor, etc.
Irreversible Antagonist
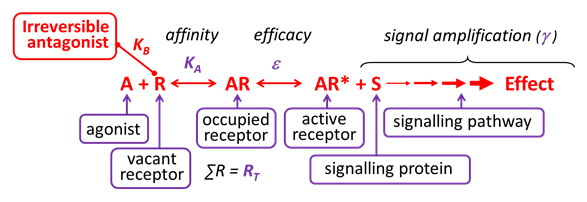
An irreversible antagonist binds covalently (not reversibly) to the same binding site on the receptor as the agonist (orthosteric binding), without activating the receptor.
Such antagonists irreversibly inhibit agonist-induced responses, until new functional receptors are expressed by the cell. Irreversible antagonism is one form of non-competitive antagonism.
Relatively few clinically-used receptor antagonists are considered to act irreversibly – e.g. naloxazone at the opioid mu receptor, phenoxybenzamine at the α adrenoceptor. Some drugs act ‘pseudoirreversibly’ and occupy the orthosteric binding site for relatively long periods without forming a covalent bond e.g. tiotropium at the muscarinic cholinoceptor.
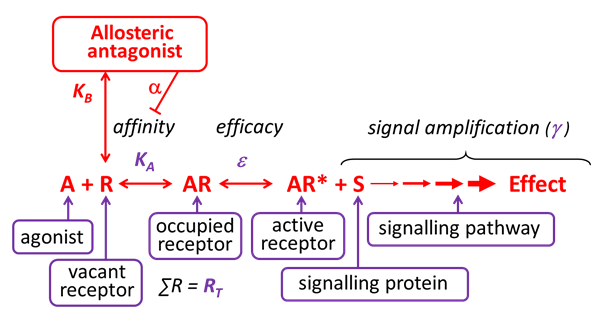
Allosteric Antagonist (Affinity)
Allosteric antagonists bind reversibly to receptors, without activating the receptor, at a site that is different from the agonist binding site.
Some allosteric antagonists reduce agonist affinity (without affecting efficacy), thereby inhibiting agonist-induced effects. They are also referred to as negative allosteric modulators (NAMs). Unlike competitive antagonists, the effects of an allosteric antagonist are saturable – this is because once the allosteric site is saturated, there are no further allosteric effects on the agonist.
Allosteric antagonism is another form of non-competitive antagonism, as a receptor can bind both the agonist and the allosteric antagonist simultaneously.
Relatively few clinically-used receptor antagonists are considered to act as negative allosteric modulators although this is an active area of research, e.g. maraviroc at the CCR5 receptor is an allosteric antagonist. In contrast, drugs such as the benzodiazepines act as positive allosteric modulators and enhance the binding affinity of the agonist
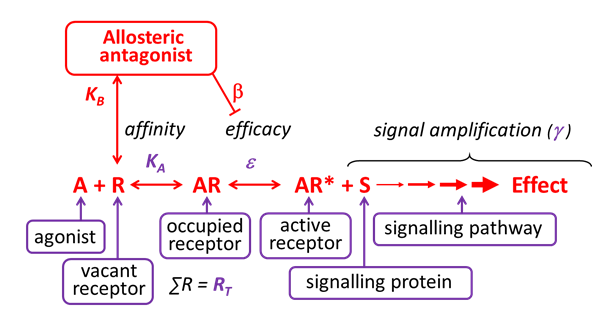
Allosteric Antagonist (Efficacy)
Allosteric antagonists bind reversibly to receptors, without activating the receptor, at a site that is different from the agonist binding site. Some allosteric antagonists primarily reduce agonist efficacy (without changing affinity), thereby inhibiting agonist-induced effects.
They are also referred to as negative allosteric modulators (NAMs). Unlike competitive antagonists, the effects of an allosteric antagonist are saturable – this is because once the allosteric site is saturated, there are no further allosteric effects on the agonist. Allosteric antagonism is another form of non-competitive antagonism, as a receptor can bind both the agonist and the allosteric antagonist simultaneously.
Functional Antagonist
Functional antagonists are agonists that produce a functional effect in the cell that is the opposite of that produced by another agonist (e.g. agonist A constricts smooth muscle, whereas agonist B relaxes smooth muscle).
The net effect produced depends upon the relative properties of the respective agonists (affinity & efficacy) and their signalling pathways (RT & Signal Amplification).
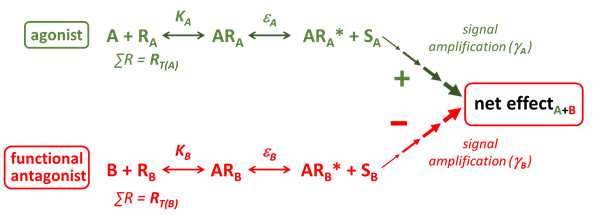
An example of a functional antagonist would be salbutamol, which by activating β2-adrenoceptors on airway smooth muscle and producing relaxation can functionally antagonise airway smooth muscle contraction induced by a wide array of spasmogenic agonists including acetylcholine, histamine and leukotrienes, each acting through their own specific receptors.
Inverse Agonist
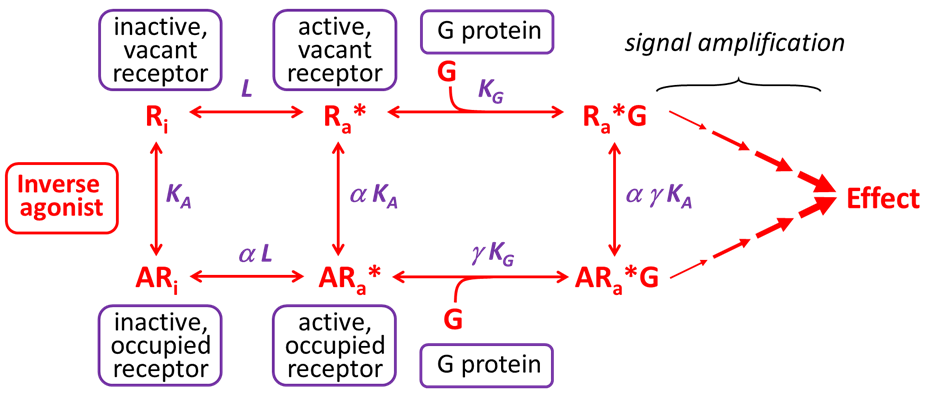
In the late 1980s, Costa and Herz discovered that G protein-coupled receptors (GPRCs) can be spontaneously active in the absence of an agonist (Ra*, see top part of the figure below), and produce an elevated basal cellular response. This phenomenon is termed ‘constitutive receptor activity’, and is associated with two important developments.
The first development was the introduction of the ‘extended ternary complex model’ (shown below), which recognises that receptors exists in equilibrium between (at least) two states, an inactive conformation (Ri, that cannot signal)) and an active conformation (Ra*, that can signal). The ratio of active to inactive receptors (Ra*/Ri) is termed L and describes the isomerisation efficiency of a receptor. L depends upon the number and strength of intramolecular stabilising contacts within the receptor. A high L value reflects a low energy barrier to spontaneous formation of the Ra* conformation and reflects a receptor that is more likely exist in the Ra* conformation, and thereby exhibit constitutive receptor activity. The L value is constant for, but will vary considerably between, receptor subtypes.
The second key development was the recognition that particular ligands, called ‘inverse agonists’, could bind to receptors and reduce constitutive receptor activity. A feature of inverse agonists is their higher affinity the inactive receptor conformation (Ri) over the active receptor conformation (Ra*). By selectively binding to the inactive receptor conformation, inverse agonists increase the proportion of receptors in the inactive conformation (Ri), and decrease the population of receptors in the active conformation (Ri*). Inverse agonists are said to have negative intrinsic efficacy. Partial inverse agonists are ligands that have greater affinity for Ri than Ra*, but less selectivity for Ri over Ra*, compared to full inverse agonists.
In the schema shown below, the term α refers to the fold higher affinity the ligand has for the active receptor over the inactive receptor, and for an inverse agonist, α < 1. Thus an α value of 0.1 indicates the inverse agonist has a 10-fold higher affinity for the inactive receptor (Ri) over the active receptor (Ra*). Similarly, the term γ refers to the fold higher affinity of the receptor for the G protein when the receptor is bound by the ligand, and for an inverse agonist, γ < 1. Thus a γ value of 0.1 indicates that the receptor is 10-fold less likely to bind to a G protein when it is bound by the inverse agonist.
Note, in this model, a conventional agonist that binds to activates the receptor will have a higher affinity for Ra* over Ri (α > 1) and will promote the binding of the receptor to the G protein (γ > 1). Furthermore, because the inverse agonist binds to the orthosteric site on the receptor, without activating the receptor, it will act as a competitive antagonist in the absence of constitutive receptor activity.