Why might Schild Plots be Non-Ideal?


Click on a plot to see why a Schild Plot might have that particular shape!


plots
linear1 linear2 nonlinear1 nonlinear4 nonlinear2 nonlinear3

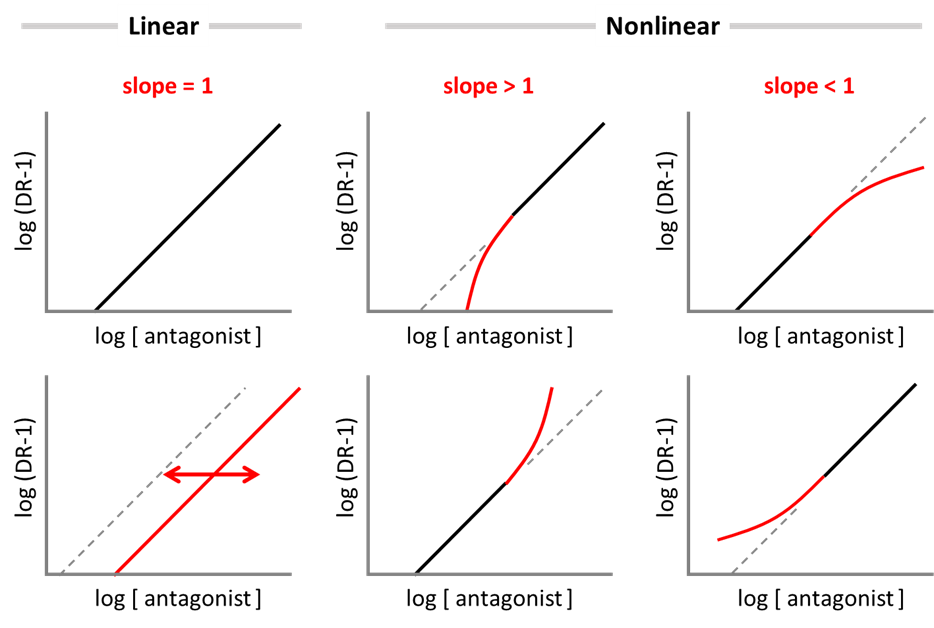
Explanations of why Schild Plots have a particular shape

Schild plot is linear with a slope not significantly different from 1.0 (Ideal Schild Plot)


Schild plots obtained to competitive antagonists should be linear with a slope that is not significantly different from 1.0. If these criteria are met then the antagonist pA2 value (derived from the x-intercept) can typically be used as a measure of the affinity (-logKB) of the antagonist for the receptor mediating the agonist-induce response.

Nevertheless, if should be recognised that a linear Schild plot with a slope that is not significantly different from 1.0 provides only presumptive evidence of competitive antagonism, not proof of competitive antagonism. For example, under some restrictive conditions (e.g. use of a narrow antagonist concentration range), there are instances of allosteric, irreversible and functional antagonists generating Schild plots that satisfy the conditions of linearity and unit slope. Thus, confirmatory evidence of competitive antagonism should be obtained from binding studies that directly evaluate the molecular interactions between ligands and receptors.

A clear strength of the Schild analysis is that the shape and position of the Schild plot should be:

  1. Independent of the level of response (effect) used to calculate the dose ratio (DR), as competitive antagonists produce parallel, rightward shifts of agonist dose-response curves
  2. Independent of the characteristics of the cell or tissue, such as receptor density and signal amplification
  3. Independent of the characteristics of the agonist used, including affinity and efficacy

When used in conjunction with receptor-selective antagonists, the Schild analysis offers a powerful method for characterising receptor function in cells and tissues.

Click me to go back to all plots.


Schild plot is linear with unit slope, but generates unreliable pA2 values


Ideally Schild plots obtained to competitive antagonists should be linear with a slope that is not significantly different from 1.0. Typically, if these criteria are met then the antagonist pA2 value (derived from the x-intercept) can theoretically be used as a measure of the affinity (-logKB) of the antagonist for the receptor mediating the agonist-induce response.

However, there are instances whereby linear Schild plots with unit slope have generated pA2 values that are not accurate estimates of the actual affinity of the antagonist for the receptor (-logKB value). There are several mechanisms through which this phenomenon might occur, including the following.

The competitive antagonist has not been equilibrated with the tissue for sufficient time

If an antagonist cannot readily penetrate into a tissue (diffusion is a rate-limiting step), then the use of shorter-than-optimum equilibration times will generate Schild plots that are positioned to the right of plots obtained when longer, more appropriate equilibration times have been used (Kenakin, 1982). Thus, the effect of a shorter-than-optimum equilibration time will be to under-estimate both the pA2 and affinity of the antagonist. Of course, this issue can be remedied by increasing the period of exposure of the antagonist such that complete equilibration of the antagonist with the receptor is achieved.

Additional drugs are being used in the study that also interact with the receptor

It is often necessary to use additional drugs in Schild plot studies e.g. to inhibit uptake processes, degradative enzymes, and/or other receptor subtypes. If an additional drug, for example an uptake inhibitor, also possesses considerable receptor blocking activity, then the Schild plot for the competitive antagonist will be displaced to the right (proportional to the concentration of the uptake inhibitor). Such an effect will result in under-estimation of both the pA2 and affinity of the antagonist (Kenakin, 1982). This issue can be remedied by changing the additional drugs used to particular drugs that do not have an action at the receptor of interest.

Click me to go back to all plots.


Schild plot is nonlinear with a slope > 1.0 at low concentrations


Ideally Schild plots obtained to competitive antagonists should be linear with a slope that is not significantly different from 1.0. However, there are several instances whereby the Schild plot deviates from linearity at low concentrations of antagonist, and the slope in this region of the plot is greater than 1.0 (see figure above). This effect is typically indicative of several mechanisms, as follows:

The competitive antagonist is a substrate of a saturable uptake system

If the antagonist is a substrate of a saturable uptake system, then the concentration of the antagonist in the vicinity of the receptor is less than that predicted based on the concentration administered (to the solution surrounding the cells or tissue), resulting in a lower-than-expected level of antagonism of an agonist-induced response (smaller than predicted DR value). However, at higher concentrations of the antagonist, the uptake system becomes saturated and the concentration of antagonist in the vicinity of the receptor is closer to that predicted based on the dose administered, and the expected level of antagonism is produced.

This issue can be remedied by blocking the saturable uptake system for which the antagonist is a substrate.

The competitive antagonist has not been equilibrated with the tissue for sufficient time

If an antagonist cannot readily equilibrate with the receptor, then lower concentrations of the antagonist require a longer period of time to equilibrate than higher concentrations. Thus, if the equilibration time is shorter than that required for the lowest concentration of antagonist used, then these lower concentrations will be less effective and produce lower DR values than predicted (see Fig. 2, Kenakin, 1982, p257) – resulting in slopes greater than one at the lower regions of the Schild plot.

Of course, this issue can be remedied by increasing the period of exposure of the antagonist such that equilibration of the antagonist with the receptor is achieved.

Click me to go back to all plots.


Schild plot is nonlinear with a slope < 1.0 at low concentrations


Ideally Schild plots obtained to competitive antagonists should be linear with a slope that is not significantly different from 1.0. However, there are some well-documented examples where the Schild plot deviates from linearity at low concentrations of antagonist, such that the slope in this region of the plot is less than 1.0 (see figure above). This effect is typically related to the properties of the agonist, rather than the antagonist.

If the agonist is a substrate of a saturable uptake system, then the concentration of the agonist in the vicinity of the receptor is less than that predicted based on the concentration administered (to the solution surrounding the cells or tissue), resulting in a lower-than-expected level of agonist-induced response – this will be particular evident in the control (no antagonist) agonist dose-response curve and those completed in the presence of low concentrations of antagonist. However, when higher concentrations of the agonist are used (e.g. in the presence of higher concentrations of the competitive antagonist) the uptake system for the agonist becomes saturated and the concentration of agonist in the vicinity of the receptor will be closer to that predicted based on the concentration administered, and the expected level of antagonism is produced (see Figure).

This effect has been extensively reported in relation to studies characterising adrenoceptors, as some adrenoceptor agonists (e.g. noradrenaline) are substrates of neuronal uptake systems, whereas other agonists (e.g. isoprenaline) are not substrates (Kenakin, 1982). The magnitude of effect will depend on the tissue being investigated as the characteristics of saturable uptake systems varies considerably. Of particular note, pA2 values obtained for antagonists when neuronal uptake of the agonist has not been blocked are unlikely to provide reliable measures of antagonist affinity.

This issue can be remedied by blocking the saturable uptake system for which the agonist is a substrate, for example by using cocaine to block the neuronal uptake of noradrenaline.

Click me to go back to all plots.


Schild plot is nonlinear with a slope > 1.0 at high concentrations


Ideally Schild plots obtained to competitive antagonists should be linear with a slope that is not significantly different from 1.0. However, if the Schild plot deviates from linearity at high concentrations of antagonist, such that the slope in this region of the plot is greater than 1.0 (see figure above), then this may indicate that high concentrations of either the agonist or antagonist are producing toxicity in these cells or tissue.

A characteristic feature of toxicity is reduced responsiveness of the cells/tissue to agonists, which is manifest as a decrease in agonist potency and maximum effect. Thus, if only high concentrations (of agonist or antagonist) are producing toxicity, then elevated DR values produced by the combined effects of antagonist and toxicity will only be evident in the latter phases of the Schild plot. In this instance, the lower concentrations of antagonist that are non-toxic can be reliably used to generate pA2 values and logKB values (if that portion of the Schild plot is linear with unit slope).

Of course, this issue can be remedied by using competitive antagonists and agonists that are non-toxic. As toxicity is typically concentration-dependent, the use of highly potent agonists and antagonists will likely be advantageous in this setting.

Click me to go back to all plots.


Schild plot is nonlinear with a slope < 1.0 at high concentrations


Ideally Schild plots obtained to competitive antagonists should be linear with a slope that is not significantly different from 1.0. As mentioned elsewhere, this plateauing of the Schild plot at high concentrations of antagonist is typically seen with allosteric antagonists.

However, this phenomenon may also be observed with competitive antagonists under certain conditions (Kenakin, 1982), as indicated below.

  1. High concentrations of antagonist increases the sensitivity of the tissue to the agonist
  2. High concentrations of the antagonist produce agonist-like responses in the tissue
  3. High concentrations of the agonist activates a second type of receptor/pathway that mediates the same response, but which is not blocked by the antagonist
  4. High concentrations of the agonist release an endogenous agonist that overcomes the effects produced by the antagonist

These effects can be remedied by the careful selection of agonists and antagonists for use in Schild studies.

Click me to go back to all plots.


Learn more about how the properties of the antagonist and agonist influence the shape and position of Schild Plots

You can also jump to the detailed descriptions here!

Competitive Antagonist
Competitive antagonist is a substrate of saturable uptake system
Agonist is a substrate of a saturable uptake system
Competitive antagonist is toxic
Irreversible antagonist
Allosteric antagonist
Functional antagonist


Competitive Antagonist


Characteristic features

The Schild plot to a competitive antagonist should be:

  1. Linear with a slope that is not statistically different from 1.0
  2. Independent of the affinity and efficacy of the agonist used
  3. Independent of the level of Effect used to calculate the dose ratio (DR) (as agonist dose-response curves are shifted in parallel manner)
  4. Independent of the characteristics of the cell, such as receptor density and signal amplification
  5. Independent of the period of exposure of the antagonist with the cell/tissue (so long as sufficient time is allowed for equilibrium to be achieved)

Additional points of note

The pA2 value (x-intercept) can be used as a measure of –logKB of the antagonist for the receptor mediating the agonist-induced effect, and is a powerful method for characterising receptors.

Helpful Video


Click me to go back to all plots.


Competitive antagonist is a substrate of saturable uptake system


Characteristic features

The Schild plot is:

  1. Typically nonlinear with a slope greater than 1.0 at lower (non-saturating) concentrations. At higher (saturating) concentrations, deviation from linearity and unit slope are reduced.
  2. Independent of the affinity and efficacy of the agonist used
  3. Independent of the level of Effect used to calculate the dose ratio (DR) (as agonist dose-response curves are shifted in parallel manner)
  4. Dependent on the cell/tissue used (as the characteristics of saturable uptake systems varies between cells/tissues)
  5. Likely to be largely independent of the period of exposure of the antagonist

Potential Remedies

Repeat in the presence of an inhibitor of the saturable uptake system.

Repeat using an antagonist that is not a substrate of a saturable uptake system.


Click me to go back to all plots.


Agonist is a substrate of a saturable uptake system


Characteristic features

The Schild plot is:

  1. Typically nonlinear with a slope less than 1.0 at lower agonist concentrations (that are subject to uptake). At higher agonist concentrations (that saturate the uptake system), deviation from linearity and unit slope are less pronounced (although pA2 is under-estimated because of position of control agonist dose-response curve (no Antagonist)).
  2. Dependent on the agonist characteristics, as agonists differ in their susceptibility to uptake processes.
  3. Typically independent of the level of Effect used to calculate the dose ratio (DR) (as agonist dose-response curves are shifted in parallel manner)
  4. Dependent on the cell/tissue used (as the characteristics of saturable uptake systems varies between cells/tissues)
  5. Likely to be largely independent of the period of exposure of the antagonist (so long as sufficient time is allowed for equilibrium to be achieved)

Potential Remedies

Repeat in the presence of an inhibitor of the saturable uptake system.

Repeat using agonists that are not substrates of a saturable uptake system.


Click me to go back to all plots.


Competitive antagonist is toxic


Characteristic features

The Schild plot is:

  1. Typically linear with a slope of 1.0 at lower (nontoxic) concentrations. Higher toxic concentrations are associated with larger DR values, causing slopes > 1.0
  2. Independent of the agonist used (affinity & efficacy)
  3. Level of toxicity (and thus extent of effect) will depend on the susceptibility of the cell/tissue used
  4. Likely to be dependent on the period of exposure of the antagonist with longer periods producing greater effects (due to greater toxicity)

Additional points of note

A pA2 value (x-intercept) determined by using lower, non-toxic concentrations of the antagonist can be used as a measure of –logKB of the antagonist for the receptor mediating the agonist-induced effect (if this part of the Schild plot is linear with unit slope). In the example shown, pA2 (and –logKB) values could be determined using antagonist concentrations that were 10-7M and lower.

pA2 determinations from non-linear Schild plots with a slope > 1.0, is inappropriate, and will result in an under-estimation of the pA2 value (and an over-estimation of the KB value).

Potential Remedies

Compete analysis of Schild plot using only low [antagonist]

Repeat using non-toxic antagonist.


Click me to go back to all plots.


Irreversible antagonist


Characteristic features

The Schild plot is:

  1. Typically nonlinear with a slope that is greater than 1.0
  2. Dependent on the agonist used (especially efficacy of agonist)
  3. Dependent on the level of Effect used to calculate the dose ratio (DR) (as agonist dose-response curves are not shifted in parallel manner)
  4. Greatly dependent on cell characteristics such as receptor density and signal amplification
  5. Greatly dependent on the period of exposure of the antagonist with the cell

Additional points of note

The pA2 value (x-intercept) obtained using the lowest concentrations of antagonist (that produce small rightward shifts of the agonist dose-response curve) may be an approximation of the –logKB value of the antagonist for the receptor mediating the agonist-induced effect.

Potential Remedies

Irreversible antagonists are not suitable for use in Schild plots – use an appropriate competitive antagonist


Click me to go back to all plots.


Allosteric antagonist


Characteristic features

The Schild plot is:

  1. Typically nonlinear with a slope that is less than 1.0
  2. Dependent on the agonist used (affinity & efficacy), as the actions produced by an allosteric antagonist will differentially affect the binding of agonists to the orthosteric binding site.
  3. Independent of the level of Effect used to calculate the dose ratio (DR) (as agonist dose-response curves are shifted in parallel manner)
  4. Independent of cell characteristics such as receptor density and signal amplification
  5. Independent of the period of exposure of the antagonist with the cell (so long as sufficient time is allowed for equilibrium to be achieved)

Potential Remedies

Allosteric antagonists are not suitable for use in Schild plots – use an appropriate competitive antagonist.


Click me to go back to all plots.


Functional antagonist


Characteristic features

The Schild plot is:

  1. Typically nonlinear with a slope ≠ 1.0, especially at higher concentrations of functional antagonist
  2. Dependent on the affinity and efficacy of both the agonist and functional antagonist used
  3. Dependent on the cell characteristics, such as receptor density, signal amplification and maximum system effect (as these can vary for the agonist and functional antagonist).
  4. Dependent of the level of Effect used to calculate the dose ratio (DR) (as agonist dose-response curves are shifted in a non-parallel manner)

Additional points of note

The pA2 value (x-intercept) obtained will almost invariably NOT be an accurate approximation of the affinity (-logKA) of the functional antagonist for its cognate receptor. That is, it will provide no useful information on the receptor mediating the agonist-induced response.


Click me to go back to all plots.